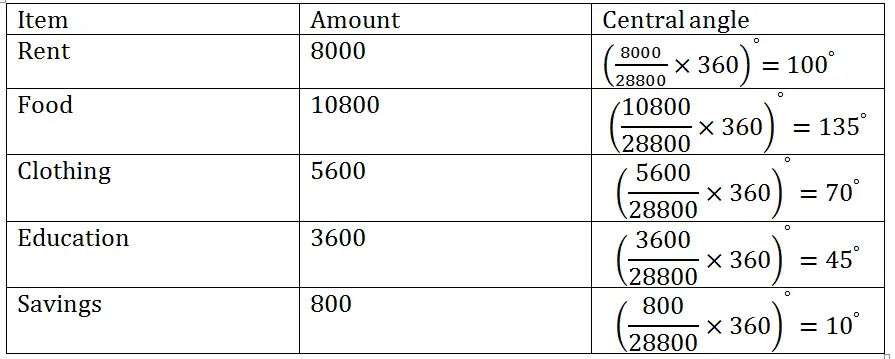
(1) The monthly income of a family is Rs 28800. The monthly expenditure of the family on various items is given below.
| Item | Rent | Food | Clothing | Education | Savings |
| Expenditure (in Rs) | 8000 | 10800 | 5600 | 3600 | 800 |
Represent the above data by a pie chart.
Solution: Total money = Rs 28800
Calculation of central angles
Construction of pie chart
(i) Draw a circular of any convenient radius.
(ii) Draw a horizontal radius of this circle.
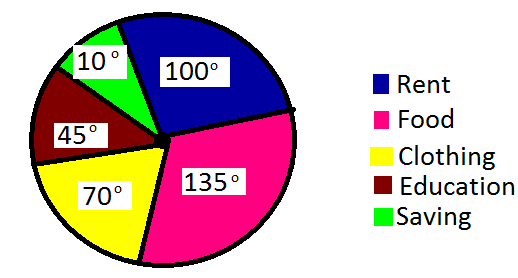
(iii) Starting from the horizontal radius, draw sectors whose central angles are 100o, 135o, 70o, 45o, 10o.
(iv) Shade the sectors so obtain the required pie chart, as shown in the adjoining figure.
Thus, we obtain the required pie chart, as shown in the adjoining figure.
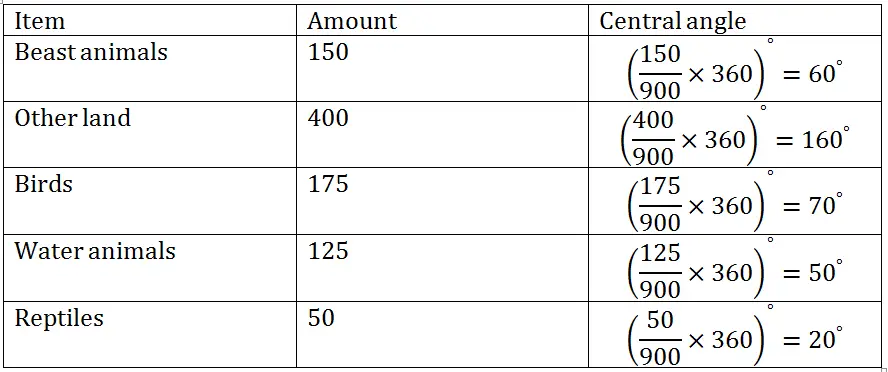
(2) There are 900 creatures in a zoo as per list given below:
| Beast animals | Other land animals | Birds | Water animals | Reptiles |
| 150 | 400 | 175 | 125 | 50 |
Represent the above data by a pie chart.
Solution: Total creatures = 900
Calculation of central angles
Construction of pie chart
(i) Draw a circular of any convenient radius.
(ii) Draw a horizontal radius of this circle.
(iii) Starting from the horizontal radius, draw sectors whose central angles are 60o, 160o, 70o, 50o, 20o.
(iv) Shade the sectors so obtain the required pie chart, as shown in the adjoining figure.
Thus, we obtain the required pie chart, as shown in the adjoining figure.

(3) Various modes of transport used by 1260 students in a given school are given below:
| School bus | Private bus | Bicycle | Rickshaw | On foot |
| 350 | 245 | 210 | 175 | 280 |
Represent the above data by a pie chart.
Solution: Total transport = 1260
Calculation of central angles

Construction of pie chart
(i) Draw a circular of any convenient radius.
(ii) Draw a horizontal radius of this circle.
(iii) Starting from the horizontal radius, draw sectors whose central angles are 100o, 70o, 60o, 5o, 8o.
(iv) Shade the sectors so obtain the required pie chart, as shown in the adjoining figure.
Thus, we obtain the required pie chart, as shown in the adjoining figure.
![]()
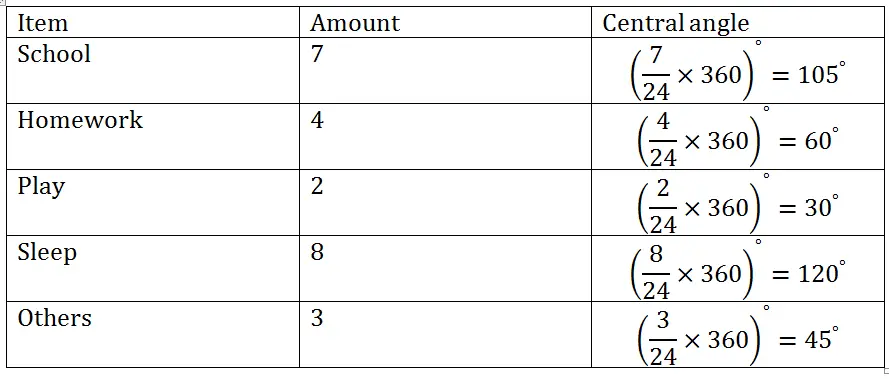
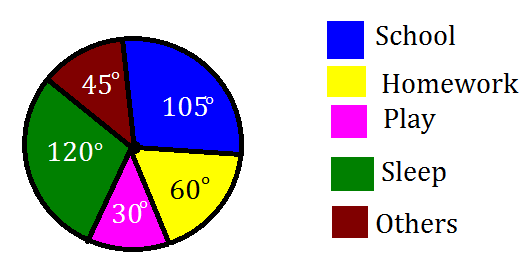
(4) The data given below shows number of hours spent by a school boy on different activities on a working day.
| Activity | School | Homework | Play | Sleep | Others | Total |
| Number of hours | 7 | 4 | 2 | 8 | 3 | 24 |
Represent the above data by a pie chart.
Solution: Total spent time = 24
Calculation of central angles
Construction of pie chart
(i) Draw a circular of any convenient radius.
(ii) Draw a horizontal radius of this circle.
(iii) Starting from the horizontal radius, draw sectors whose central angles are 105o, 60o, 30o, 120o, 45o.
(iv) Shade the sectors so obtain the required pie chart, as shown in the adjoining figure.
Thus, we obtain the required pie chart, as shown in the adjoining figure.
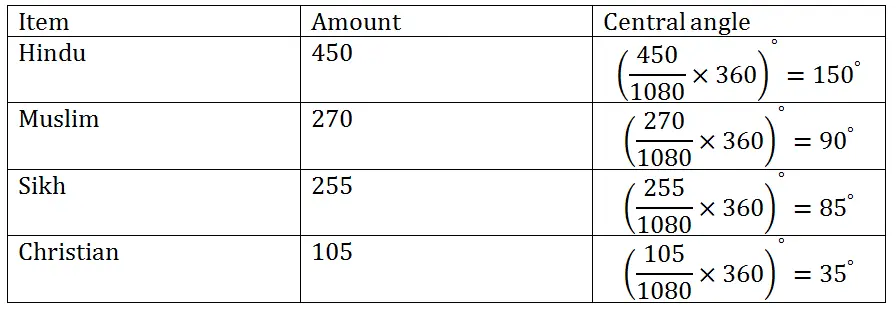
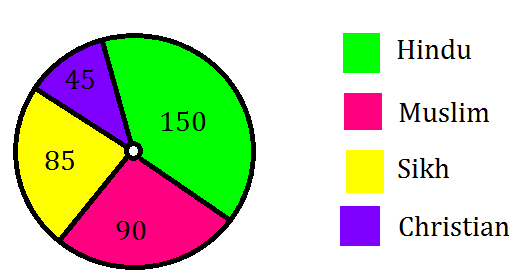
(5) The data on religion wise division of 1080 workers of a factory are given below:
| Religion | Hindu | Muslim | Sikh | Christian |
| Number of workers | 450 | 270 | 255 | 105 |
Draw a pie chart to represent the above data.
Solution: Total worker = 1080
Calculation of central angles
Construction of pie chart
(i) Draw a circular of any convenient radius.
(ii) Draw a horizontal radius of this circle.
(iii) Starting from the horizontal radius, draw sectors whose central angles are 105o, 90o, 85o, 35o.
(iv) Shade the sectors so obtain the required pie chart, as shown in the adjoining figure.
Thus, we obtain the required pie chart, as shown in the adjoining figure.
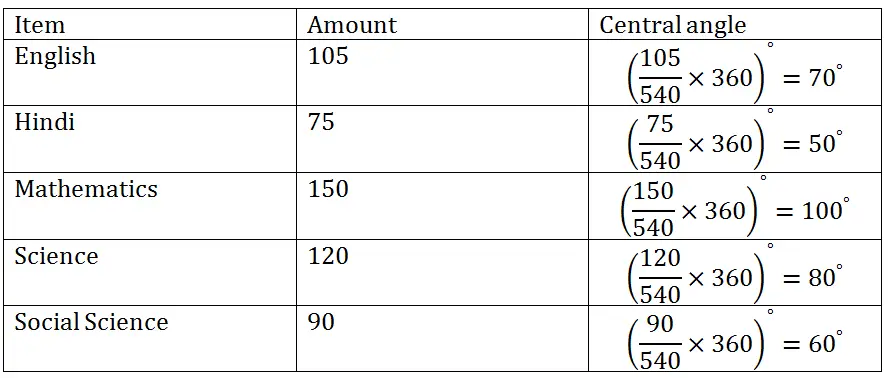
(6) The marks obtained by Sudhir in an examination are given below:
| Subject | English | Hindi | Mathematics | Science | Social Science |
| Marks obtained | 105 | 75 | 150 | 120 | 90 |
Represent the above data by a pie chart.
Solution: Total marks obtained = (105+75+150+120+90) = 540
Calculation of central angles
Construction of pie chart
(i) Draw a circular of any convenient radius.
(ii) Draw a horizontal radius of this circle.
(iii) Starting from the horizontal radius, draw sectors whose central angles are 70o, 50o, 100o, 80o, 60o.
(iv) Shade the sectors so obtain the required pie chart, as shown in the adjoining figure.
Thus, we obtain the required pie chart, as shown in the adjoining figure.
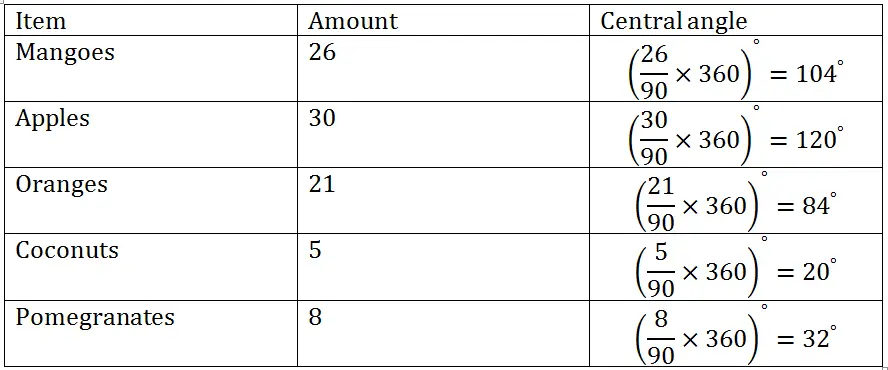
(7) The following table gives the number of different fruits kept in a hamper.
| Type of fruit | Mangoes | Apples | Oranges | Coconuts | Pomegranates |
| Number | 26 | 30 | 21 | 5 | 8 |
Represent the above data by a pie chart.
Solution: Total number of fruits = (26+30+21+5+8) = 90
Calculation of central angles
Construction of pie chart
(i) Draw a circular of any convenient radius.
(ii) Draw a horizontal radius of this circle.
(iii) Starting from the horizontal radius, draw sectors whose central angles are104o, 120o, 84o, 20o, 32o.
(iv) Shade the sectors so obtain the required pie chart, as shown in the adjoining figure.
Thus, we obtain the required pie chart, as shown in the adjoining figure.
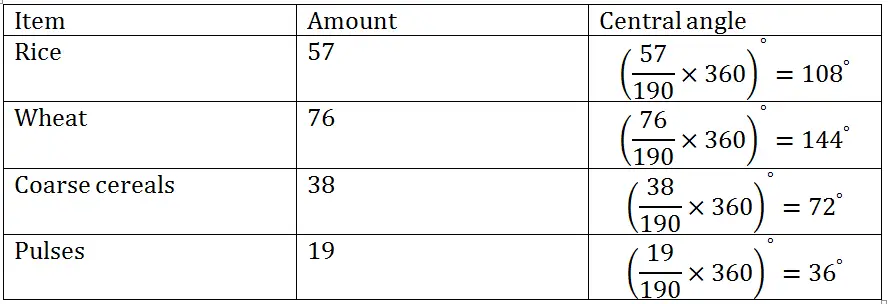
(8) The following data shows the agriculture production in India during a certain year.
| Food grain | Rice | Wheat | Coarse cereals | pulses |
| Production (in millions of tonnes) | 57 | 76 | 38 | 19 |
Draw a pie chart to represent the above data.
Solution: Total production = (57+76+38+19) = 190
Calculation of central angles
Construction of pie chart
(i) Draw a circular of any convenient radius.
(ii) Draw a horizontal radius of this circle.
(iii) Starting from the horizontal radius, draw sectors whose central angles are108o, 144o, 72o, 36o.
(iv) Shade the sectors so obtain the required pie chart, as shown in the adjoining figure.
Thus, we obtain the required pie chart, as shown in the adjoining figure.
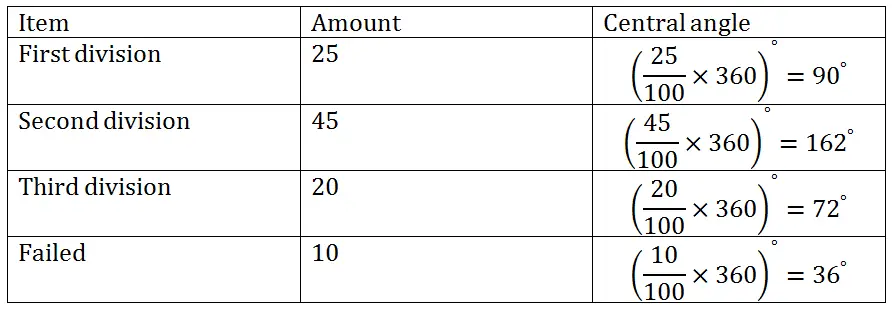
(9) Given below is the result of an annual examination of a class, showing the percentage of students in each category.
| First division | Second division | Third division | Failed |
| 25% | 45% | 20% | 10% |
Represent the above data by a pie chart.
Solution: Total percentage = (25+45+20+10) = 100
Calculation of central angles
Construction of pie chart
(i) Draw a circular of any convenient radius.
(ii) Draw a horizontal radius of this circle.
(iii) Starting from the horizontal radius, draw sectors whose central angles are90o, 162o, 72o, 36o.
(iv) Shade the sectors so obtain the required pie chart, as shown in the adjoining figure.
Thus, we obtain the required pie chart, as shown in the adjoining figure.
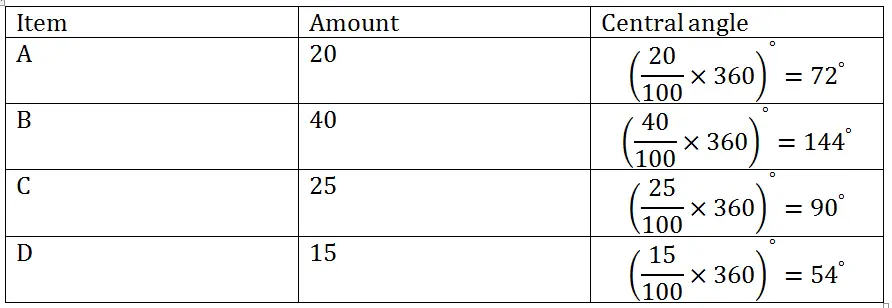
(10) The following table shows the percentages of buyers of four different brands of bathing soaps.
| Brand | A | B | C | D |
| Percentage of buyers | 20% | 40% | 25% | 15% |
Represent the above data by a pie chart.
Solution: Total percentage = (20+40+25+15) = 100
Calculation of central angles
Construction of pie chart
(i) Draw a circular of any convenient radius.
(ii) Draw a horizontal radius of this circle.
(iii) Starting from the horizontal radius, draw sectors whose central angles are72o, 144o, 90o, 54o.
(iv) Shade the sectors so obtain the required pie chart, as shown in the adjoining figure.
Thus, we obtain the required pie chart, as shown in the adjoining figure.


No comments:
Post a Comment